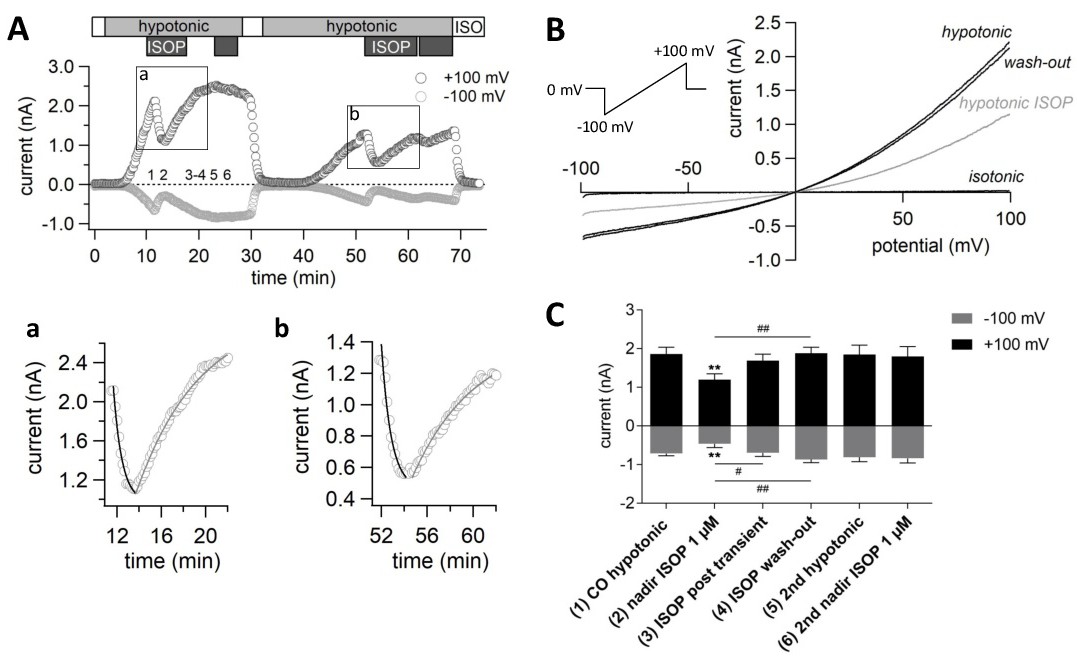
Fig. 3. Transient inhibition and desensitization of ICl,swell in response to isoproterenol (ISOP). (A) Time course of ICl,swell of a representative experiment under isotonic (ISO) and hypotonic conditions in the absence and presence of 1 µM ISOP. Each circle represents the current obtained every 10 seconds at -100 mV (lower trace) and +100 mV (upper trace). Numbers 1-3 indicate time points during the ISOP-induced transient reduction phase of ICl,swell, 4 after ISOP wash out and 5-6 during the second ISOP application. (a) and (b) are close ups of the ICl,swell time course as indicated by the windows in A. Data were fitted by single exponential functions during ICl,swell reduction (black line) and recovery (grey line), respectively. (B) Representative current-voltage relationships (Vmem ramps from -100 mV to +100 mV) recorded under isotonic and hypotonic conditions in the absence and presence of ISOP and after washout of ISOP. (C) Average amplitudes of ICl,swell under hypotonic conditions in the absence and presence of 1 µM ISOP. Results of 4-6 individual experiments as shown in panel A (n=4-6). The corresponding time points for every condition (1-6) are indicated in panel A. Asterisks indicate significant differences to control (CO). Hashes indicate significant differences as indicated. Means±SEM; ** p<0.01; # p<0.05, ## p<0.01.